Unlocking Efficient Panel Manufacturing for the ngVLA

The next-generation Very Large Array (ngVLA) radio telescope needs to build 18,000 panels in the next decade. Our metrology system is critical for reaching this goal.

Summary

The next-generation Very Large Array (ngVLA) radio telescope aims to produce 250, 18-meter aperture telescope in the next decade. This telescope will be able to resolve objects in the sky, like black holes, in a way that has never been seen before. This telescope is bound to advance humanity's understanding of fundamental physics. Building this many telescopes in such a short time is no easy feat. With each panel sizing up at roughly 2-2.5 m, the entire array will consist of about 18,000 total panels. This means that for the next decade, nearly 10 panels per working day need to be made to stay on schedule. With CMMs taking hours to perform a single measurement on these panels, a new method was needed to avoid the process bottleneck

FringeScan-3m

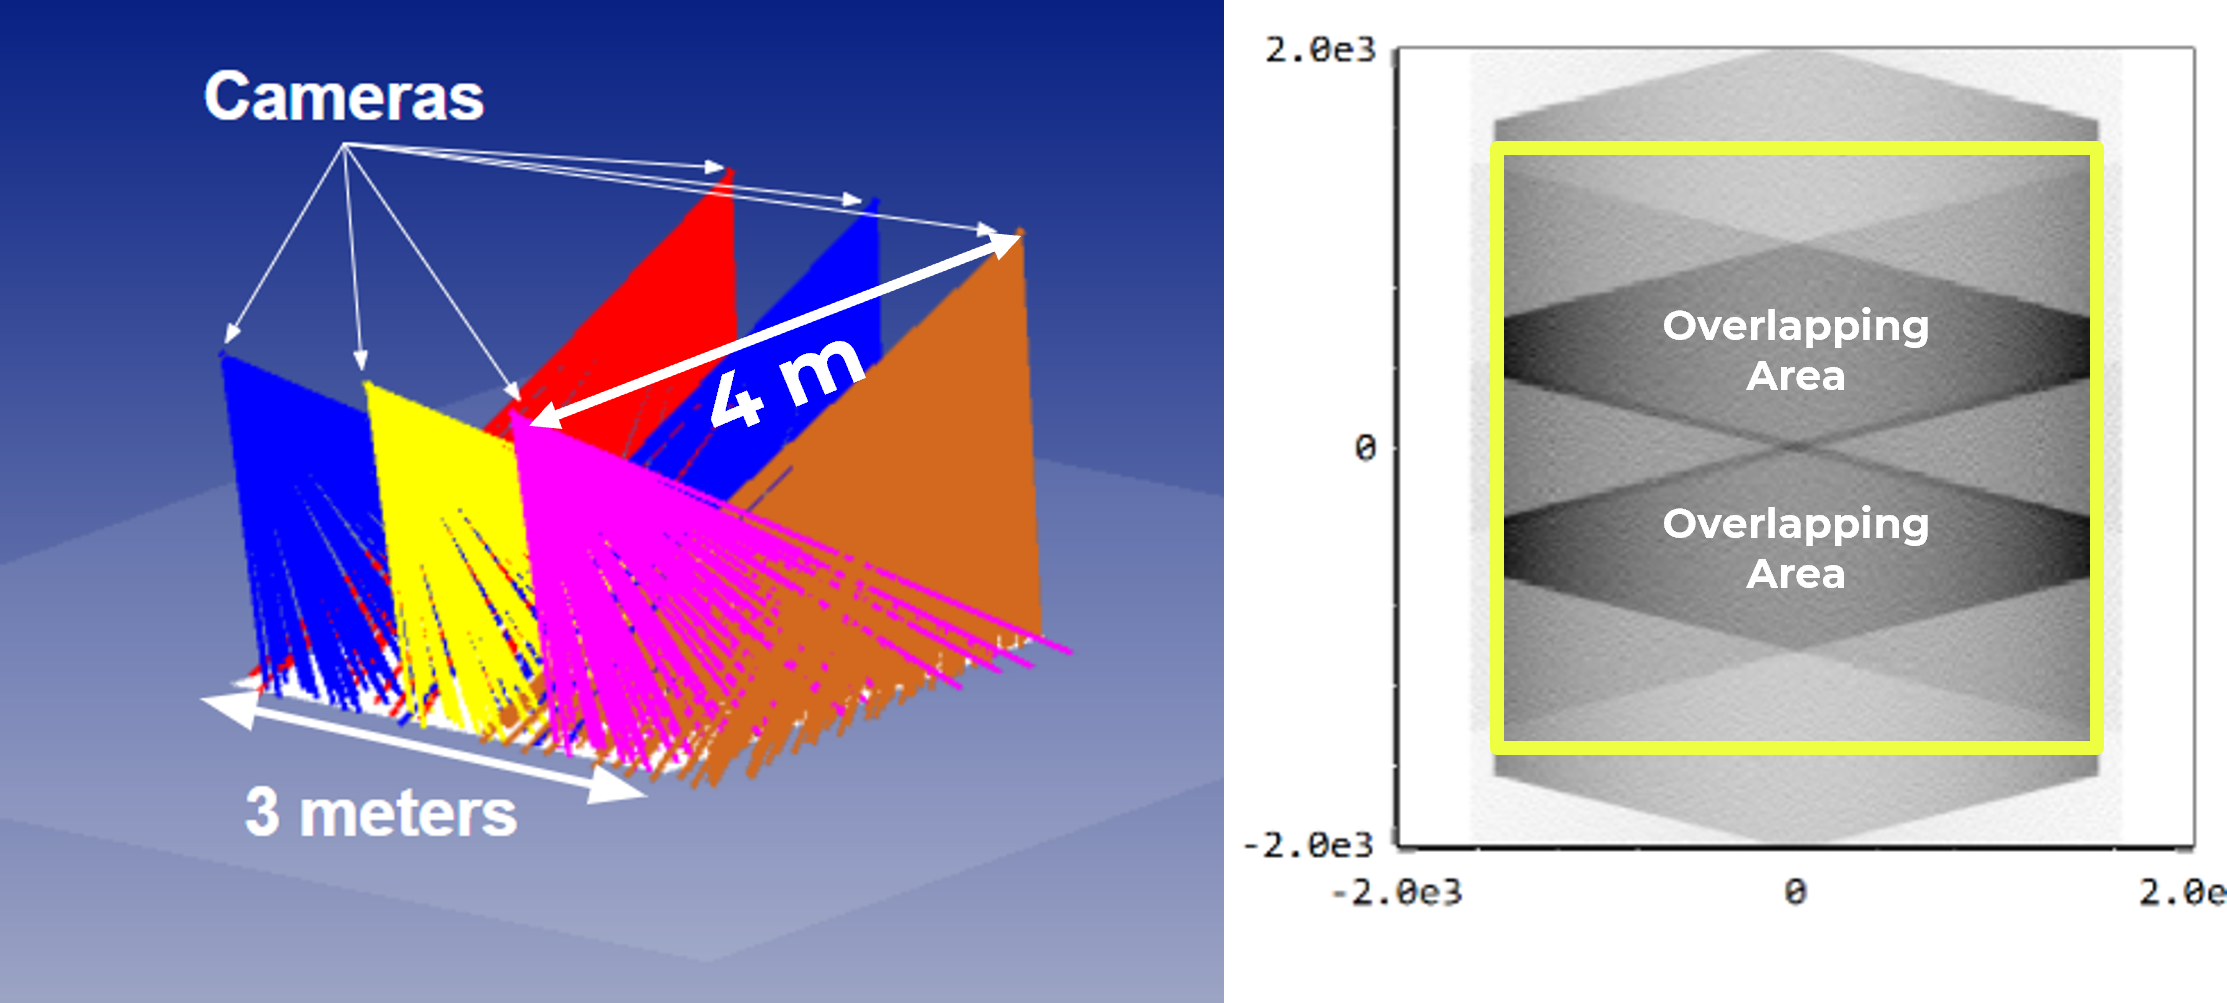
In November 2024 we delivered our largest system yet to mtex Antenna Technology Gmbh: FringeScan-3m. The system utilized 6 cameras (three cameras pairs) and an installation-caliber projector that all work in unison to cover the entire 3 meter area with a measurement time of just a few minutes. 

Layout diagram of the 3-meter system

Installation Photos and Videos

Calibration data collection example


Photos of installed system in Bavaria, Germany
Image of entire system enclosed in black tent to avoid stray light during measurements (left) and in inside view of the tent showing a test surface, the framing structure that holds all of the metrology hardware, and the project at the back (right).
​​​​

Panel Measurement Gif
Screenshot of software interface
Screenshot of our custom developed software interface. It is simple to use, requiring minimal training to begin measuring surfaces in just minutes! The UI is split into 3 main sections: Settings, Data Processing, and Analysis.
Reprojection maps of the ngVLA panel
Our system also has the unique capability of true error visualization, directly on the surface. Shown here is the raw surface map of an ngVLA panel (top), and the error map (bottom) projected directly onto the surface, physically showing where the high and low spots are on the surface.